- React.js
- D3.js
- Redux
- Material-UI
- Chart.js
- Python
- Flask
- Pandas
- NumPy
- Matplotlib
- WebSocket
- AWS
- Docker
- CI/CD

US-Based Sports Analytics Portal
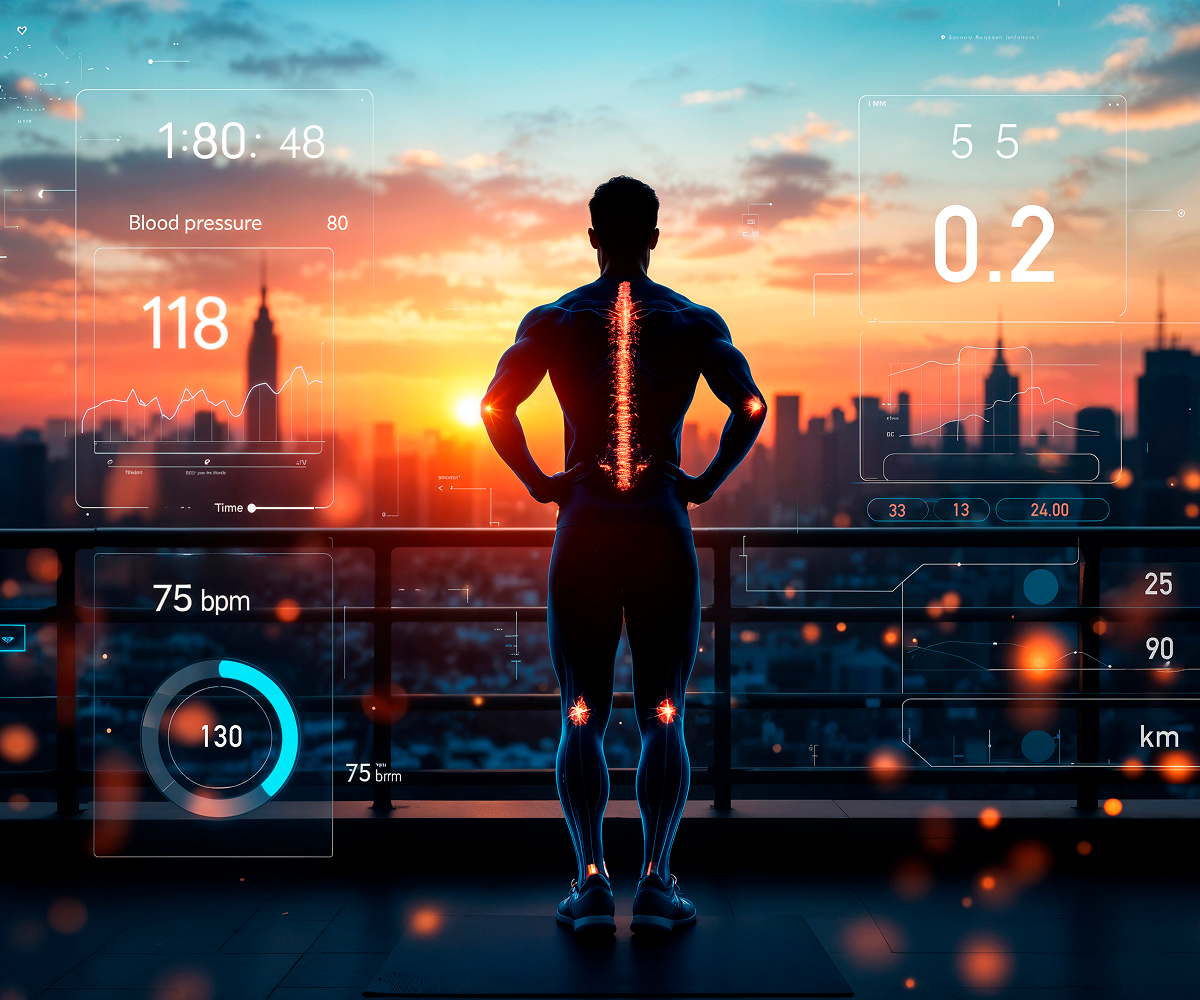
We created a widget-driven sports analytics portal designed to track player performance, strengths, and areas for improvement in real time. The platform offers comprehensive insights with live match tracking, including scores, detailed statistics, and individual player metrics. Users can personalize dashboards to view data such as player movements, scoring trends, and comparative analyses.
This user-friendly portal empowers coaches, analysts, and team managers to make informed decisions, enhancing team strategies and player growth. It also includes real-time alerts for critical events and performance milestones, ensuring stakeholders stay updated. The system is a robust solution for optimizing training and maximizing player potential.
Team Structure
Our Projects
Impacting More Than One Industry
Challenges & Solutions
How we overcame complex technical and business challenges to deliver a robust Governance, Risk, and Compliance platform and Project title pill forma ma

Real-Time Data Handling and Visualization
With live match tracking and performance metrics updating in real time, handling and displaying large amounts of data efficiently posed a significant challenge.

Solution
- We used WebSocket to enable real-time data transmission between the frontend and backend.
- For the frontend, D3.js and Chart.js were used to create dynamic and interactive charts that updated instantly as new data was received.
- On the backend, Pandas and NumPy optimized data processing, ensuring smooth and fast updates.

User Personalization of Dashboards
The portal needed to allow users to customize their dashboards, selecting which performance metrics, charts, and statistics they wanted to track.

Solution
- Using React’s modular component structure, we created customizable widgets that users could add, remove, and rearrange.
- Redux was used to manage state across the widgets and ensure real-time updates were reflected in the personalized dashboard layout.

Performance Optimization for Large Data Sets
Given the amount of live data being processed, such as player stats and live match updates, we had to ensure the portal would perform optimally even with large datasets.

Solution
- We leveraged the power of Python and its libraries like Pandas for efficient data processing.
- Additionally, we used AWS’s scalable cloud infrastructure to ensure that the platform could handle growing amounts of real-time data with minimal latency.

Displaying Complex Data in an Intuitive Way
We needed to present complex player and team performance data in an easy-to-understand format, so coaches and managers could make informed decisions without being overwhelmed by raw statistics.

Solution
- D3.js and Chart.js were integrated into the frontend to create interactive visualizations, such as heatmaps for player movements and line graphs for scoring trends.
- This allowed coaches and analysts to easily interpret data and focus on key insights.

Ensuring Cross-Device Accessibility
The platform needed to provide a seamless experience across various devices, such as desktops, tablets, and mobile phones, so coaches could access performance data from anywhere.

Solution
- Material-UI and React made it possible to build a fully responsive interface that adjusted to different screen sizes.
- With Tailwind CSS, the layout was optimized for all device types, ensuring consistent performance and usability on both mobile and desktop browsers.
Consult Us for Your Project Development
Boost business viability with tailored solutions.
Process we follow

Discovery & Consultation

Planning & Strategy

Design & Prototyping

Development & Implementation

Testing & Quality Assurance

Launch & Support
Have questions?
Get in touch!
We’re here to help you bring your ideas to life. Whether you have a project in mind, need more details about our services, or just want to explore how we can collaborate—don’t hesitate to reach out. Our team is always happy to connect, answer your questions, and guide you toward the best solutions for your goals.

